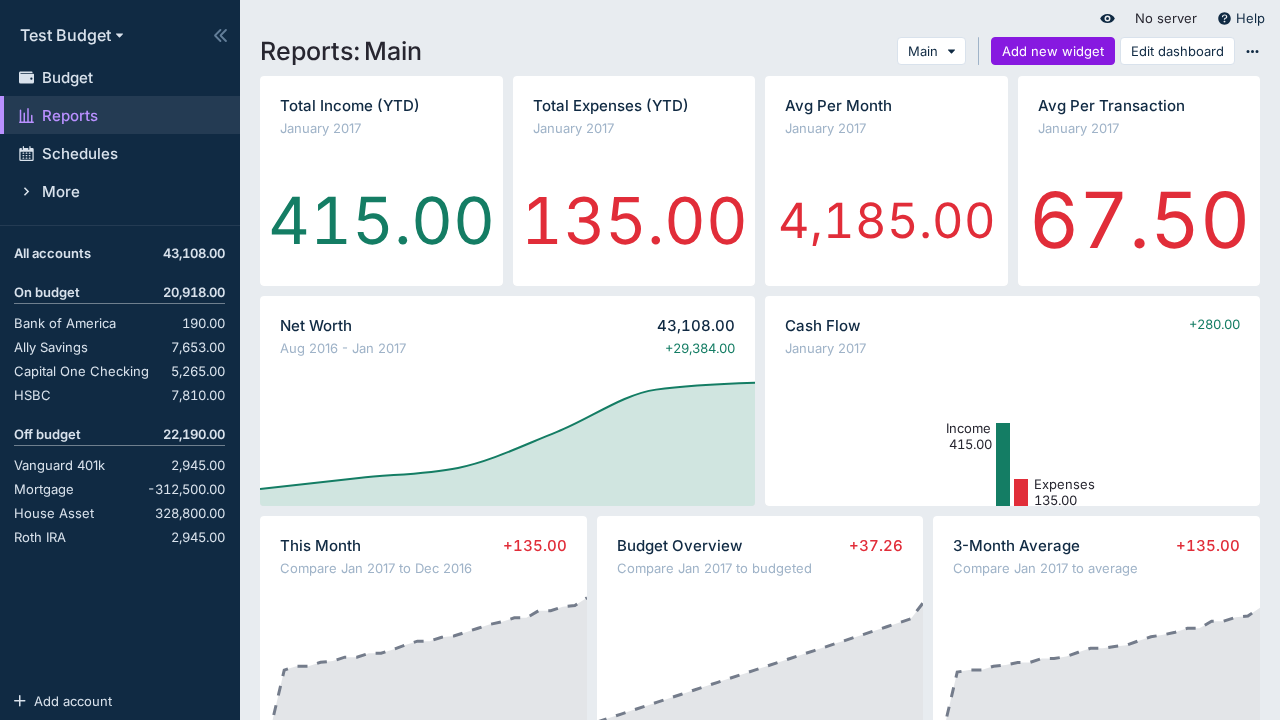
Reports Dashboard
Actual features a robust report dashboard. It is here to allow each user to do deep analysis of their transaction data.
A default dashboard is provided to get you acquainted with the capabilities of the Actual reporting system. The dashboard is fully customizable, with many available reports and widgets. If one dashboard is not enough, you can make as many dashboards as you like, each with its own set of reports and widgets.
All of the available reports can be tuned with filters and live or static date ranges. This flexibility gives each user the tools they need to understand their finances in a very deep, very personal way.
Currently, Actual comes with the following built-in widgets and reports:
- Cash Flow graph
- Net Worth graph
- Spending Analysis report
- Summary card
- Calendar card
- Text widget
- Custom Reports
- Crossover Point
The following are available as experimental features:
Cash Flow Graph
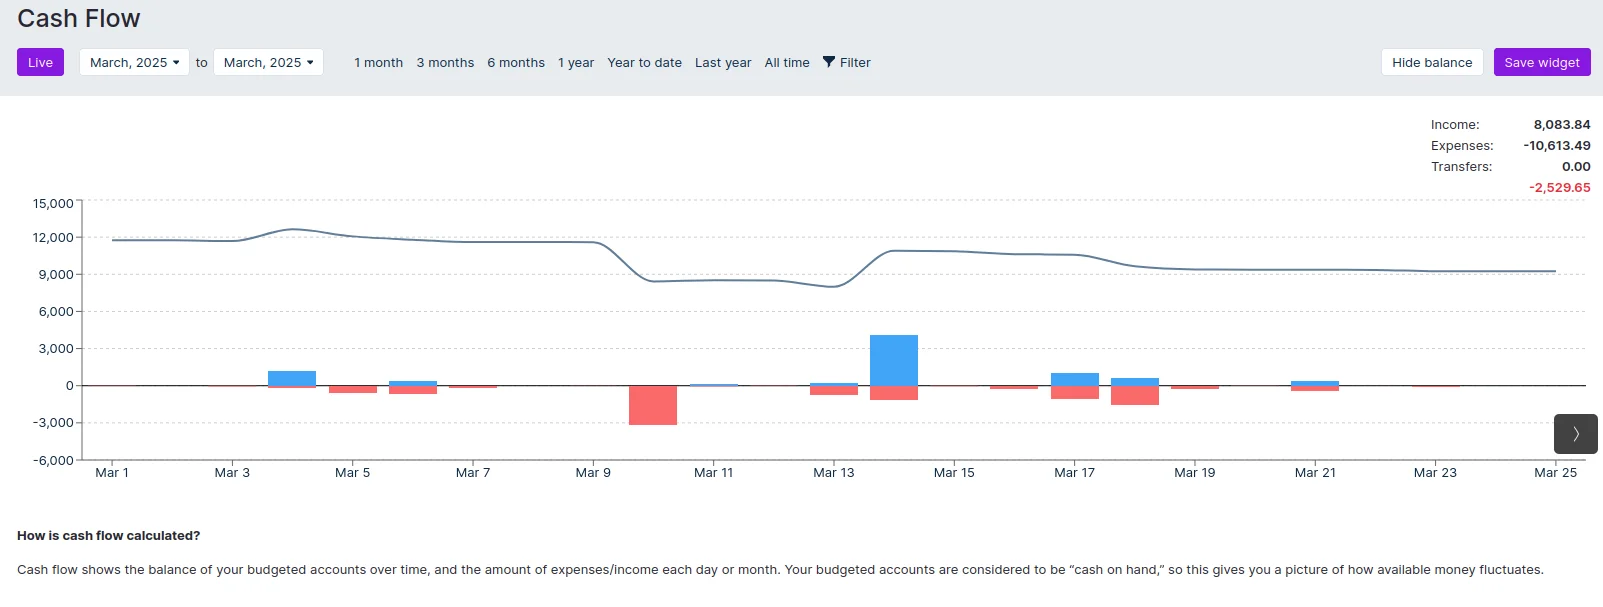
Cash flow shows your spending over time. It only looks at budgeted accounts and shows their balance over time, and includes separate income and expense visualizations. It's a quick way to see how your income and expenses affected your available money over time. Your budgeted accounts are considered to be "cash on hand," so this gives you a picture of how available money fluctuates.
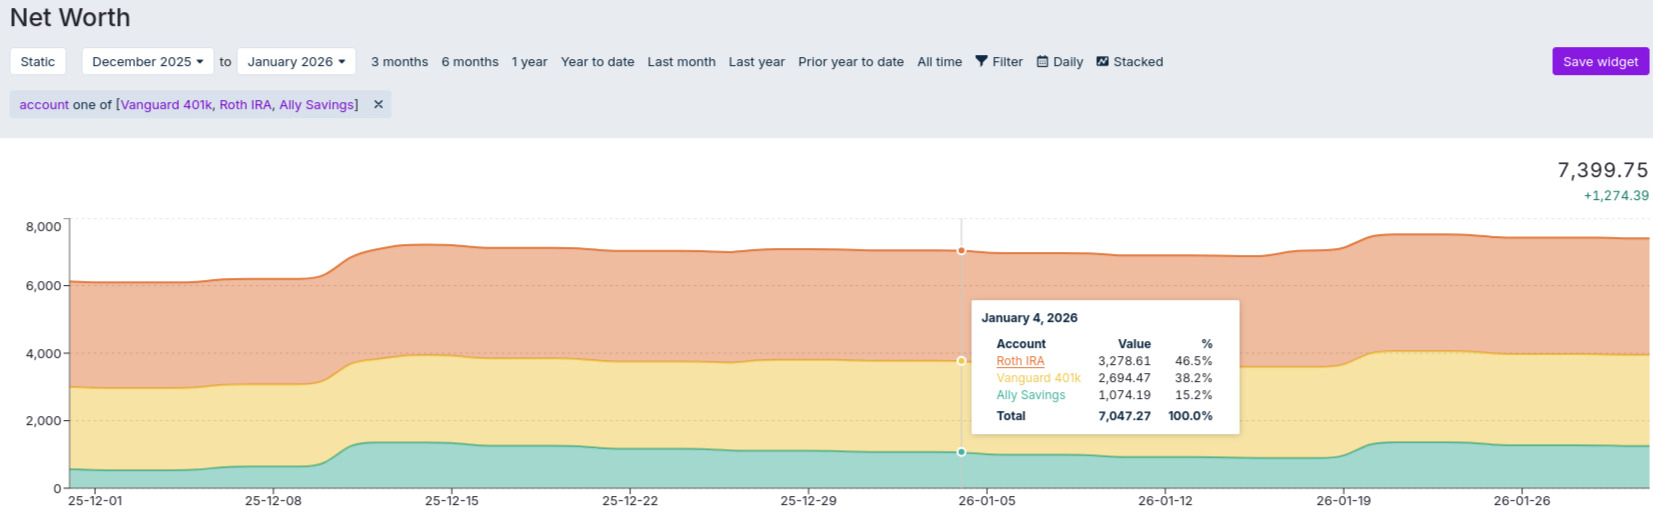
Net Worth Graph
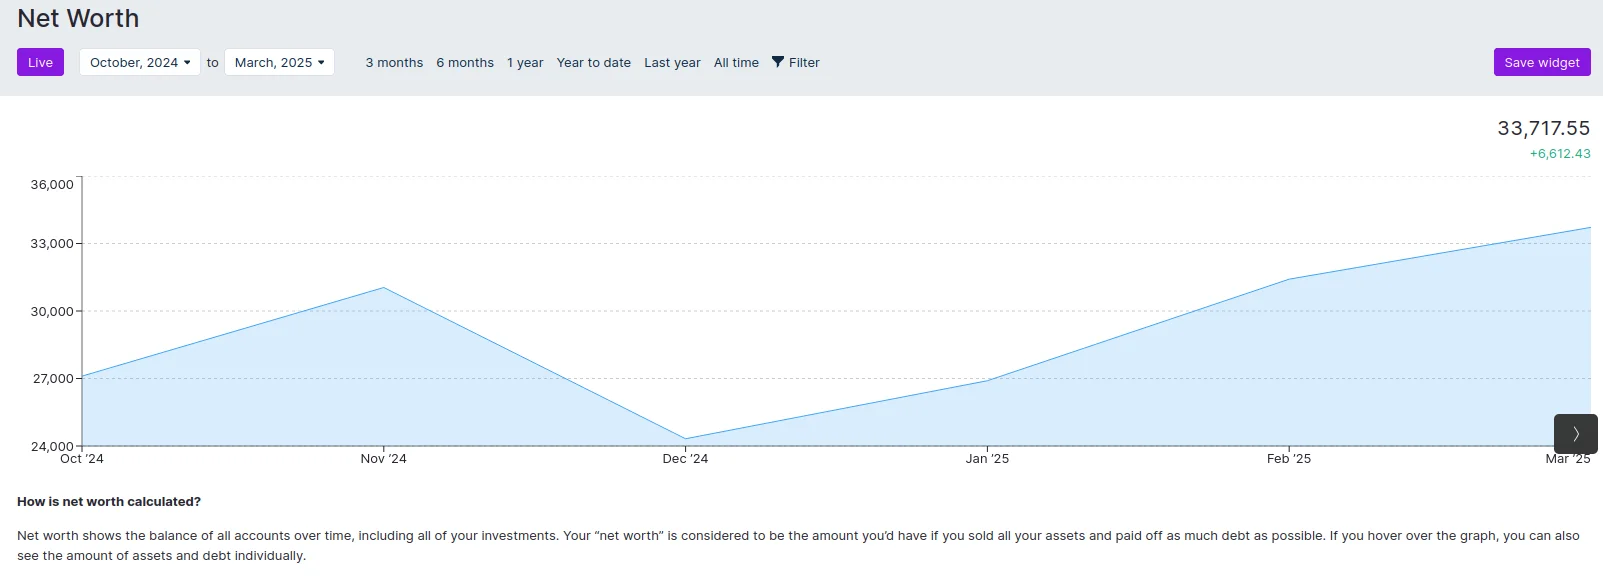
Net worth shows the balance of all accounts over time. Your net worth is all of your cash and assets minus any debts you owe. This includes all of your off budget accounts. Your "net worth" is considered to be the amount you would have left if you sold all your assets and paid off as much debt as possible.
The Net Worth graph has two modes: Trend and Stacked. Use Trend for the overall net-worth line over time. Use Stacked to separate balances by account over time (for example, savings and investment accounts). Stacked mode is harder to interpret when mixing positive-balance and negative-balance accounts.
Spending Analysis
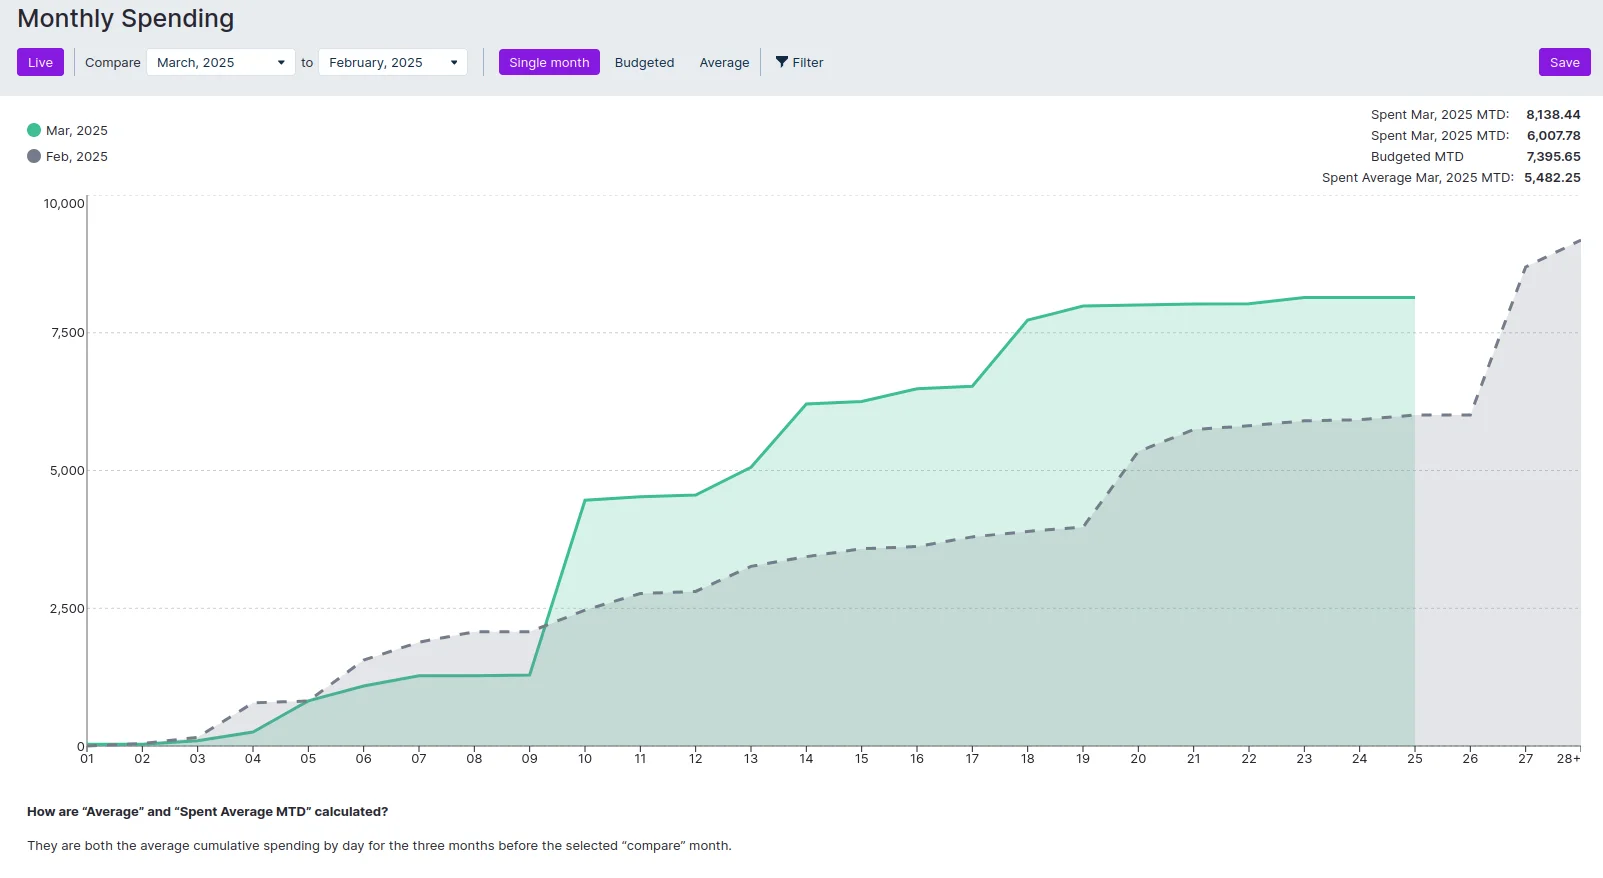
A spending analysis report tracks and compares expenses over a specified period, highlighting trends, fluctuations, and areas of overspending or savings.
Text Widget

Use Markdown to generate a text box to use as report headings and organizational labels.
Summary Card

The summary card provides an overview of all transactions within a selected time period, offering options such as total sum or monthly average.
Calendar Card
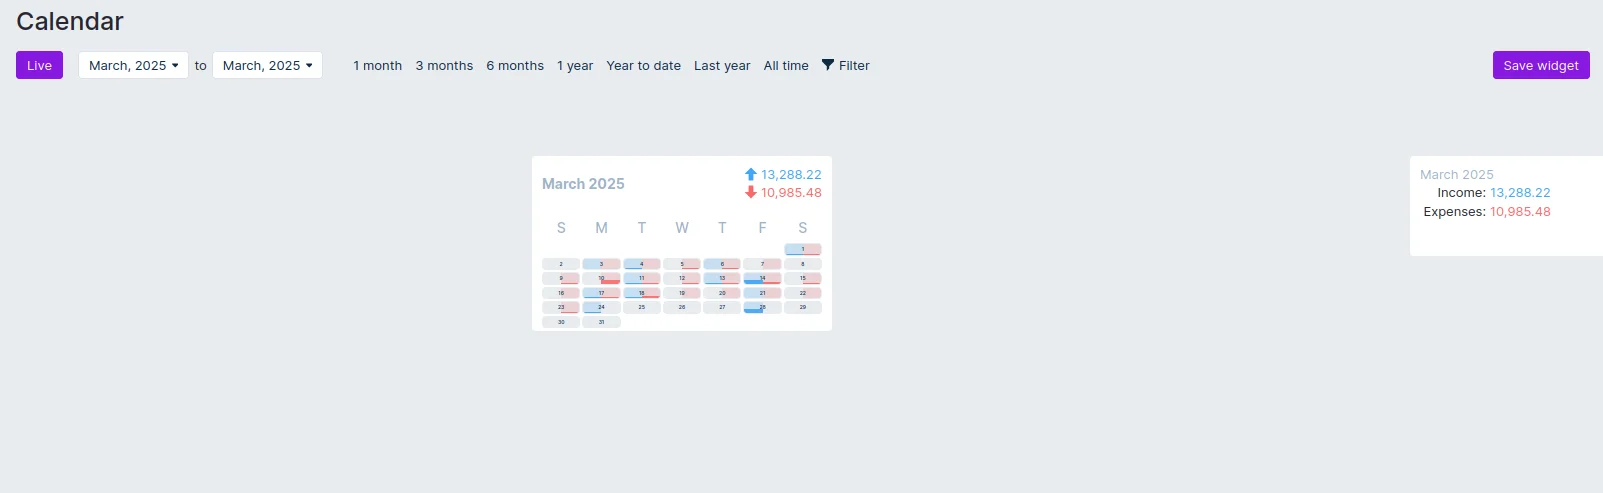
The calendar card displays daily income and expenses in a calendar format for a specified time period.
Crossover Point
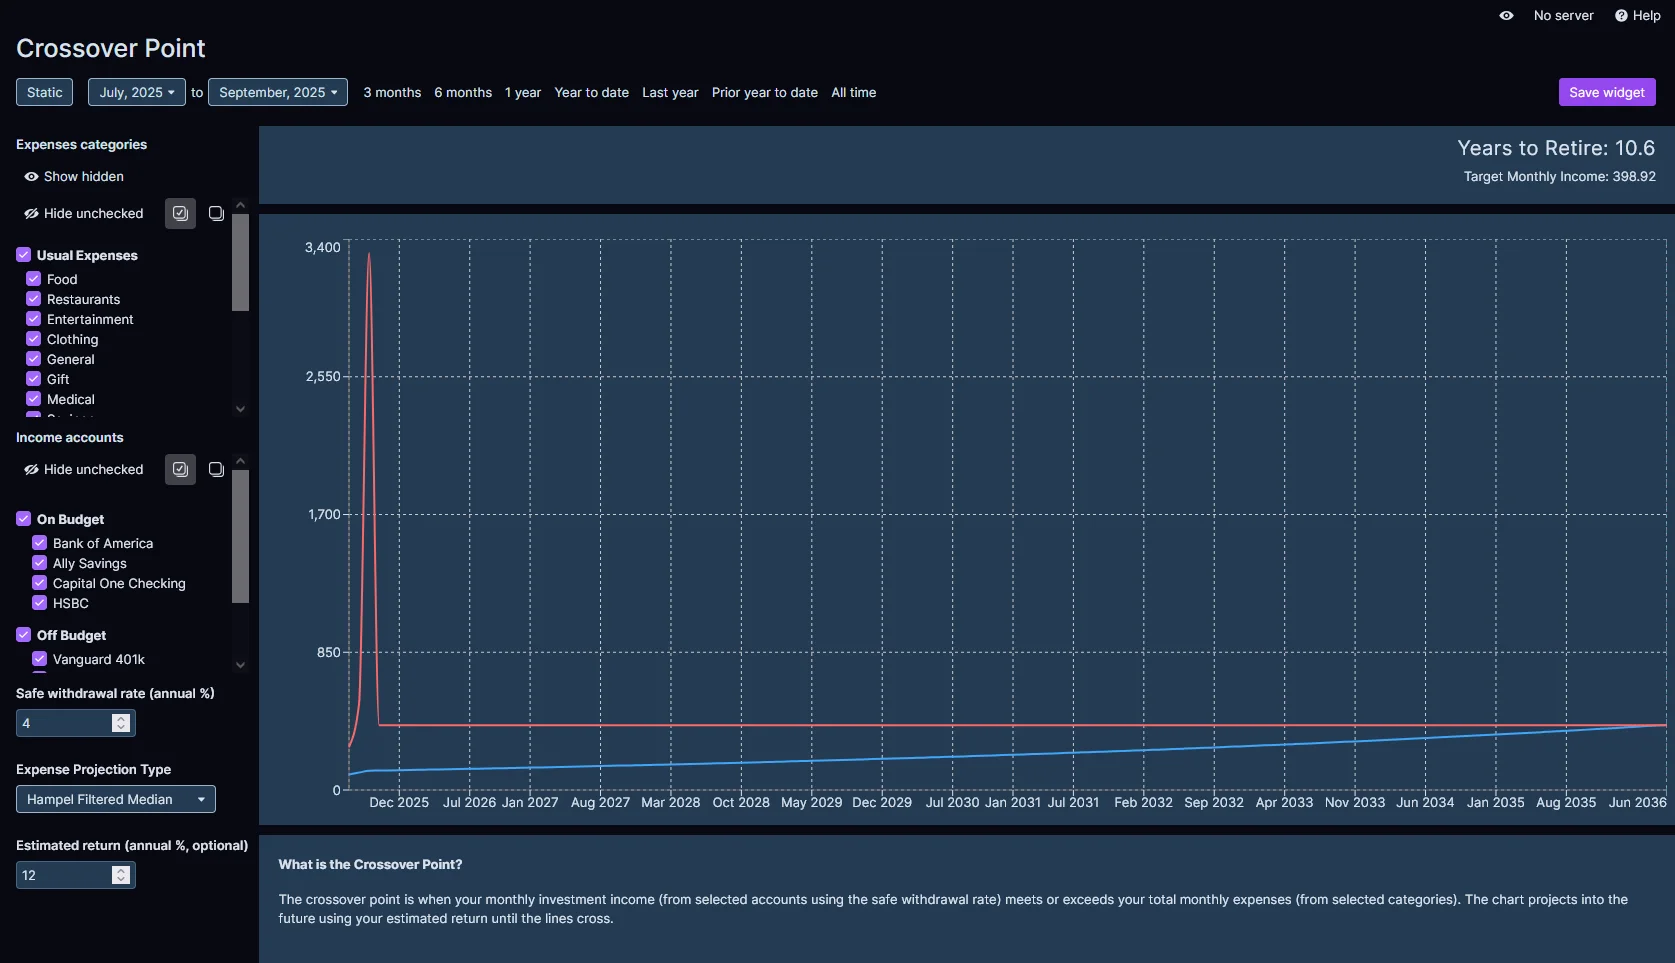
The Crossover Point report is a financial planning tool inspired by the "Your Money or Your Life" methodology. This report helps users visualize when their passive income from investments will be sufficient to cover their projected expenses, marking the point where they achieve financial independence.
Input Parameters
The crossover point report requires four key inputs to generate projections:
| Parameter | Description | Details |
|---|---|---|
| Expense Categories | Specify which Actual Budget categories are expenses that will continue beyond retirement | Used to project expenses into the future to determine when passive income will cover living expenses. Exclude categories that won't persist beyond financial independence (e.g., retirement savings contributions, work-related expenses). |
| Income Accounts | Select accounts to include when calculating passive income | Include retirement accounts (401k, IRA, etc.) and investment accounts. Exclude accounts not used for retirement funding (e.g., children's education accounts). |
| Safe Withdrawal Rate | Annual percentage of portfolio to withdraw for living expenses | Default: 4% (based on "The 4% Rule" from Trinity Study, 1998). Adjust based on risk tolerance and asset allocation. More info |
| Expense Projection Type | Method for projecting future expenses from historical data | Hampel Filtered Median: Uses a Hampel test to filter out outlier monthly expenses, then projects the median of the remaining months into the future. Median: Projects the median of historical monthly expenses, without any outlier filtering. Mean: Projects the average (mean) of all historical monthly expenses. |
| Estimated Return (Optional) | Anticipated annual rate of return for Income Accounts | Varies based on asset allocation and risk tolerance. If not provided, calculates historical return based on the change in Income Account balance over time. Note: The historical calculation includes contributions, which can inflate the rate of return. |
How It Works
Based on your selected Expense Categories and Expense Projection Type, the chart will project your expenses into the future.
Based on your selected Income Accounts, Estimated Return, and Safe Withdrawal Rate, the chart will project your passive income into the future.
When the passive income grows to exceed the projected expenses, you've achieved financial independence!