Reports
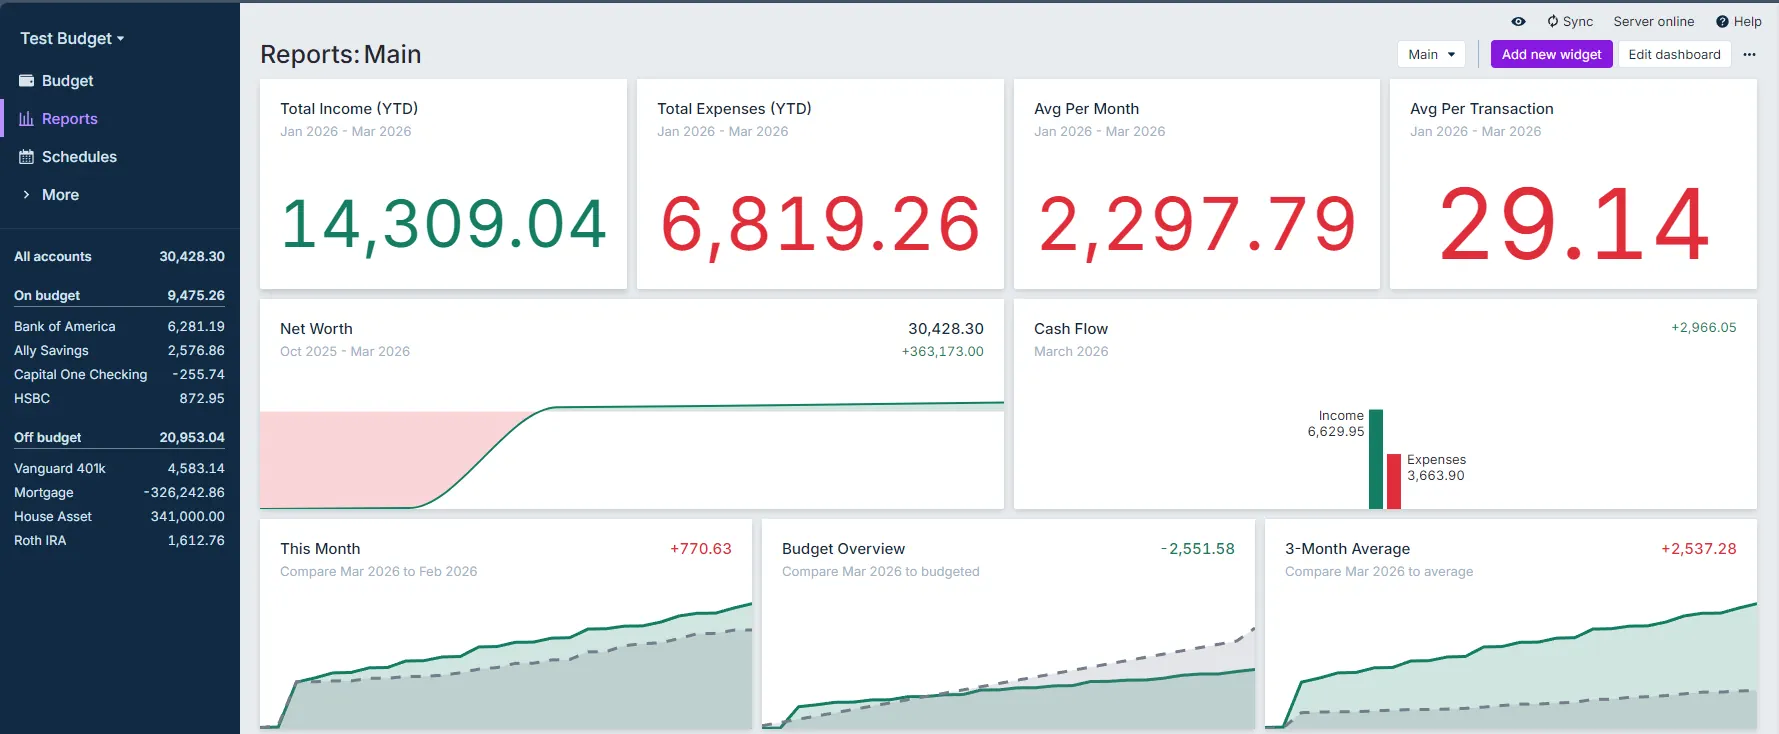
This view gives you access both to the built-in reports and also to your own custom reports.
All reports in this view are shown in their tiled version. Clicking on a tile will take you to a full-screen version of that report.
Net worth represents the overall balance of all your accounts over time. It is calculated by subtracting your debts from the total value of your cash and assets. This includes all investments. Essentially, your net worth is the amount you would have if you sold all of your assets and paid off all of your debts.
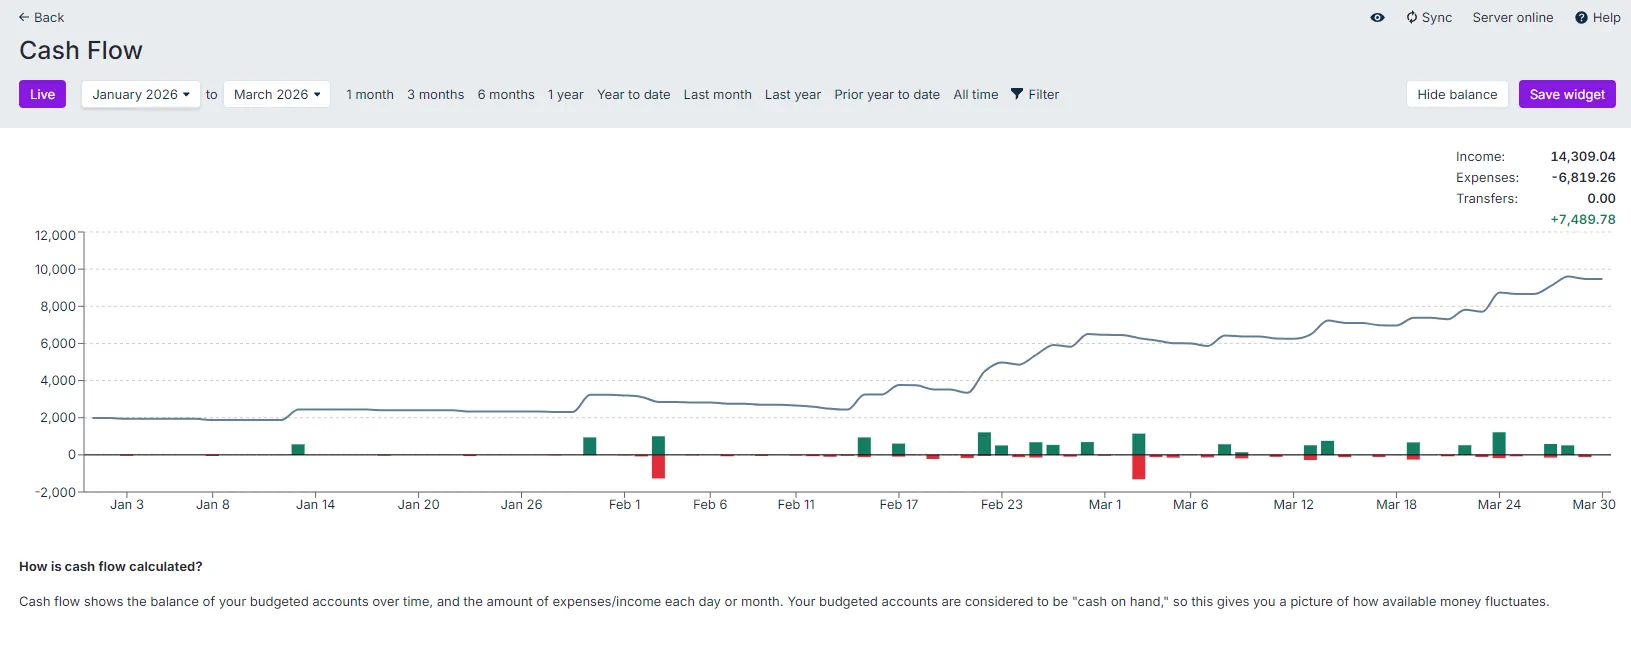
Cash flow tracks your spending over time by focusing solely on budget accounts and displaying their balances. It includes separate visualizations for income and expenses, providing a quick overview of how these factors affect your available money over time. By considering your budgeted accounts as "cash on hand," cash flow clearly shows how your available funds fluctuate.
See the Reports Dashboard for more detail on these and the other built-in reports.
Custom reports
Actual's custom reports will allow you to create reports giving in-depth analyses on your spending habits and your income. You can find them thoroughly covered in Custom Reports.
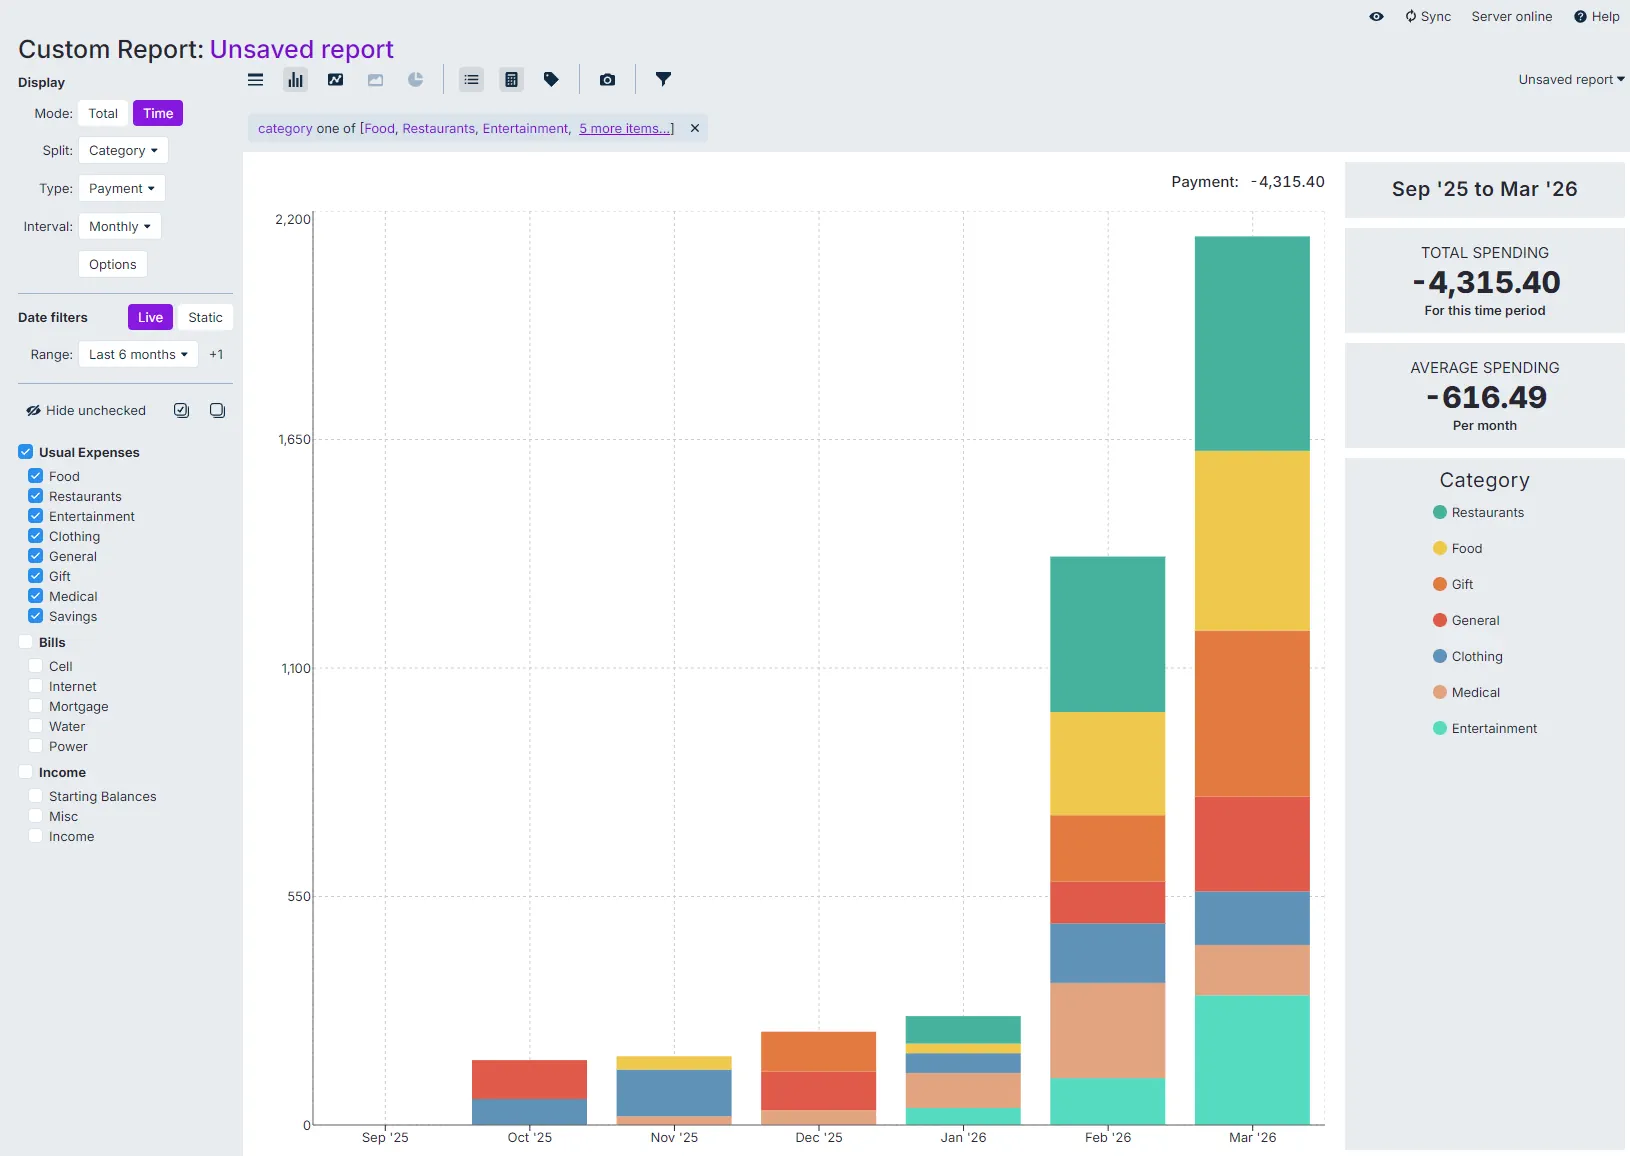
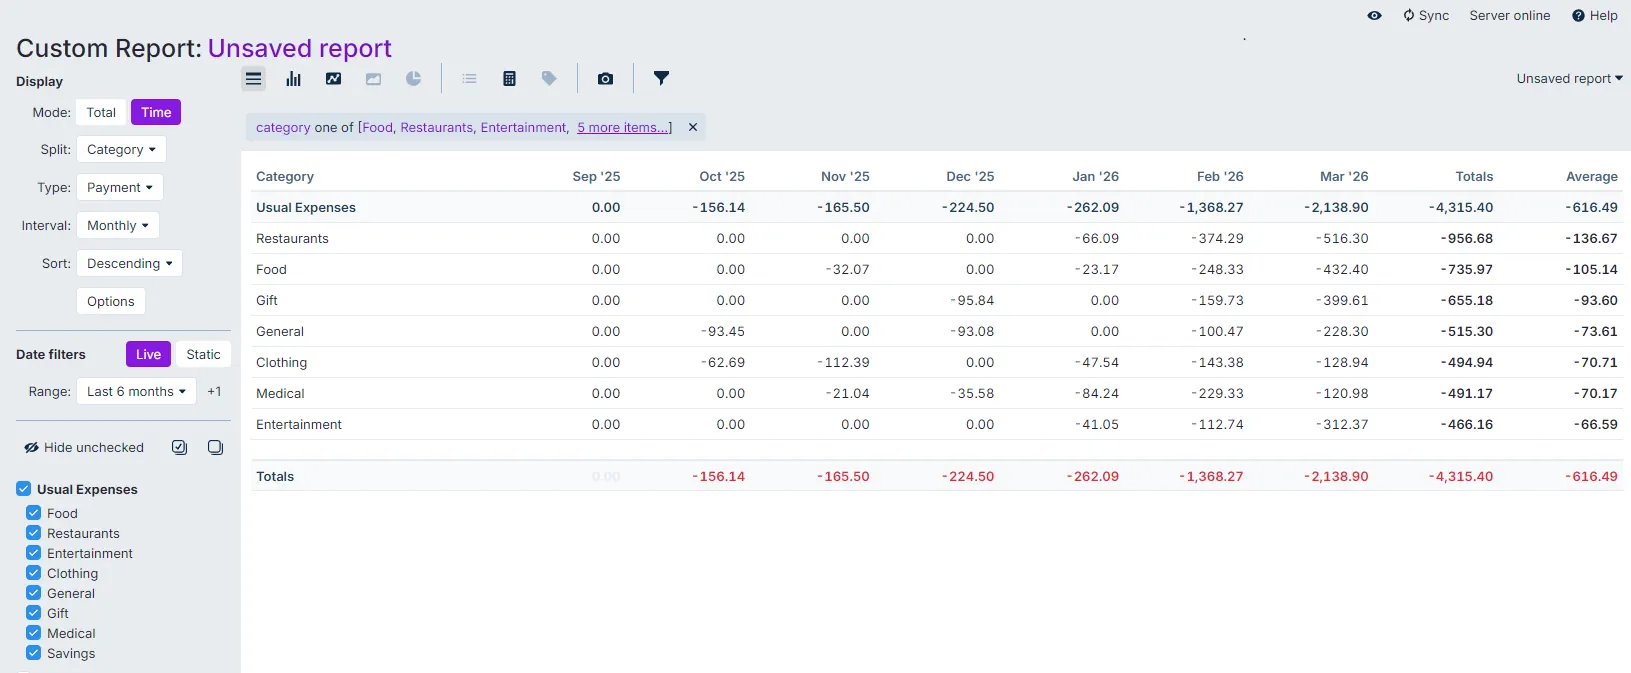
Below are examples of reports covering Daily Expenses over the last six months. One report shows this as a graph, the other as a table. Note that the table version also shows the sum and average (over six months) for the various categories.