Custom Reports
This is an experimental feature. That means we’re still working on finishing it. There may be bugs, missing functionality or incomplete documentation, and we may decide to remove the feature in a future release. If you have any feedback, please open an issue or post a message in the Discord.
All functionality described here may not be available in the latest stable release. Use the edge images for the latest implementation.
Custom reports allow analyzing transaction data by using charts or a data table with summary statistics. There are four types of reports available:
- Table View
- Bar Graph
- Area Graph
- Donut Graph
Left Menu
The Type menu can be used to change the display of transactions shown in the report:
- Payment: outflows from For budget accounts
- Deposit: inflows in For budget accounts
- Net: sum of outflow and inflows across For budget accounts. Net results are the figures shown in Budget page under Spent and Received columns. This option is currently available in Data Table, Area Graph and partially available in Bar Graph and Donut Graph
This sum can be Split by Category, Group, Payee, Account or Month. Note that Split by Account shows sum of transactions from For budget account, not periodic balance. Monthly breakdowns are provided by changing Mode from Total to Time.
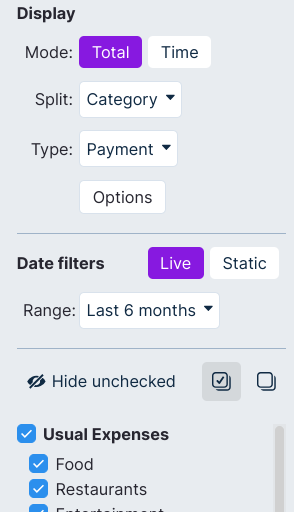
Date filters
Transactions can be filtered for a certain period of time using Range. Live Date filters show transaction data dynamically, for instance during the current month (This month). For a fixed time frame, Static Date filters will show transactions between two dates.
Options
Under Options, reports behavior can be changed
- Show hidden categories will enable Categories marked as hidden in the Budget page
- Show empty rows will show items chosen in Split with 0 value
- Show off budget enables two categories:
- Transfers: include all transfer across For budget account. Transfer from For budget to Off budget are not counted.
- Off budget: include all transactions in Off budget accounts. Transfers from For budget to Off budget are not counted.
- Show uncategorized will show transactions which have not been assigned a category
Single Categories or entire Groups can be excluded from the Report by using the list on the bottom left side. Greyed out options in dropdown menus are not yet available for the chosen report.
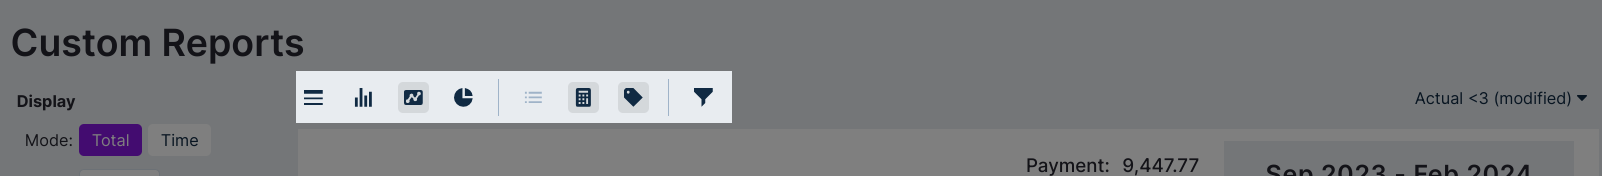
Center Menu
Icons in the first group of the center menu are used to select the displayed report, the second group is used to show graph legends, summary and labels. The funnel icon can be used to filter transactions. Finally, the menu on the right-hand side is used to Save a Custom Report to the Reports page.
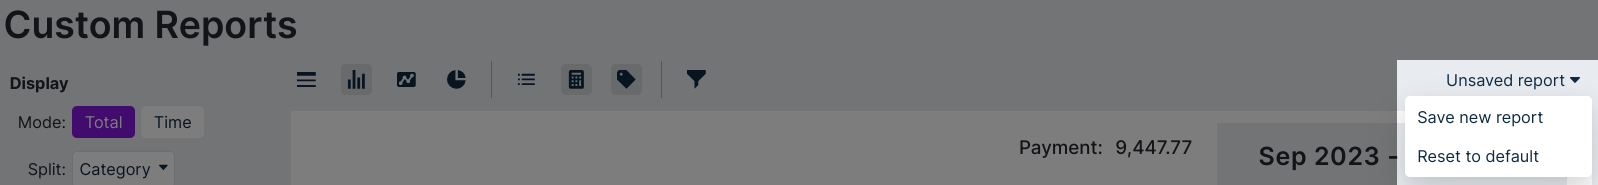
Saving a report
A custom report can be saved by using the menu on the right-hand side. If a saved report is modified it is possible to either overwrite the existing report or save the changes as a new report. The same menu can be used to reset to default if you'd like to quickly return to your saved version. Otherwise if no action is taken, the changes will be automatically discarded when leaving the current report.
Saved reports will be shown in the Report page in alphabetical order.

Example
Custom Reports are really powerful and can provide unique insights. We now highlight a complex example that uses most features. Our goal is to have a stacked bar chart broken down by group with month on X axis, in a certain time frame, excluding a certain category and payee.
- Select Bar Graph and set Time Mode
- Select Split by Group
- Use the Live Date filter and set Year to date as a Range
- Click on the checkbox next to Savings to exclude from the sum
- Click on the Filter icon, select Payee is not "Movies"
- Enable the legend, summary and label.
